Must say I’m loving SQL Operations Studio. I’m lucky enough to have some systems with 2017 already installed on them with Query Store enabled so that gives me the ability to track wait stats over a period of time inside a database. For those that are new to 2017, Query Store added the ability to track wait stats by 23 categories per query ran aggregated in the time frames you have specified. This gives you a powerful way to troubleshoot individual procedures and statements outside of just forcing a plan, no you can know what resources they are waiting on. You can read more about what the categories are on Microsoft’s documentation online here.
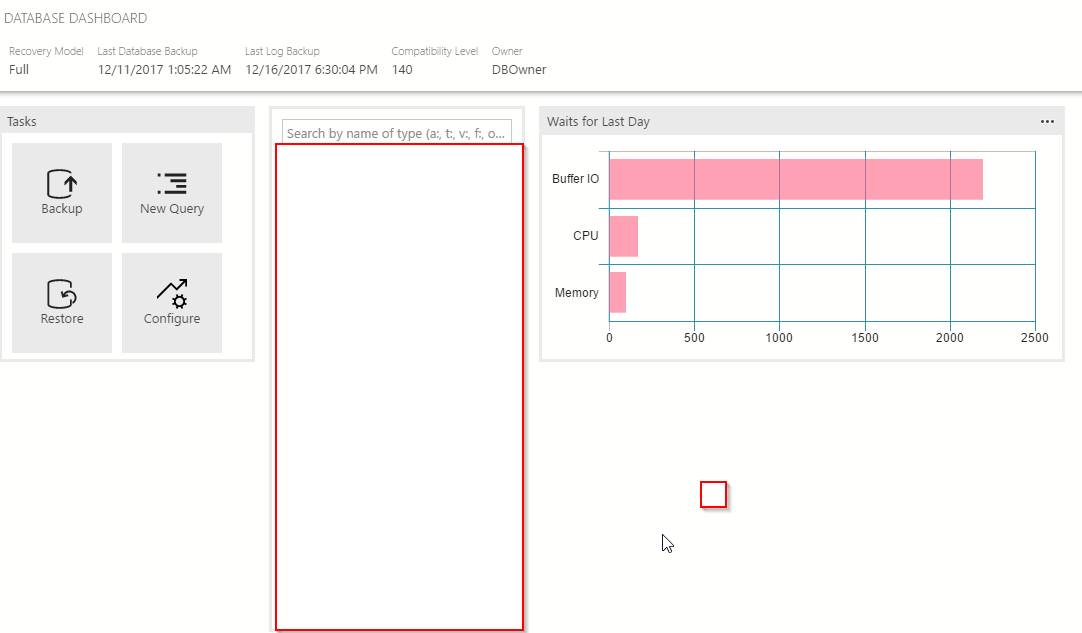
Now for why we are writing this blog post. So far there are no reports of wait stats in SSMS to visualize what is happening with wait stats inside the database. So I create a widget in SQL Operations Studio that would show me the wait stats in the last day for a particular database, obviously, I could change that to something shorter or longer. Creating a widget is actually pretty simple. First, you just write your query and save it to your c:\sqlops-windows folder assuming that is where you placed the files.
 SELECT ws.wait_category_desc,
   sum(total_query_wait_time_ms) AS sum_total_wait_ms
FROM sys.query_store_wait_stats ws
    INNER JOIN sys.query_store_runtime_stats_interval rsi on rsi.runtime_stats_interval_id = ws.runtime_stats_interval_id
WHERE rsi.start_time >= getdate () - 1
GROUP BY ws.wait_category_desc
ORDER BY sum_total_wait_ms DESC
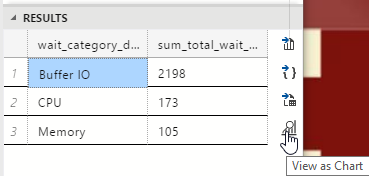
After you run the query on the right-hand side there is a small icon that says View As Chart you click on.
From there you can pick your chart options.
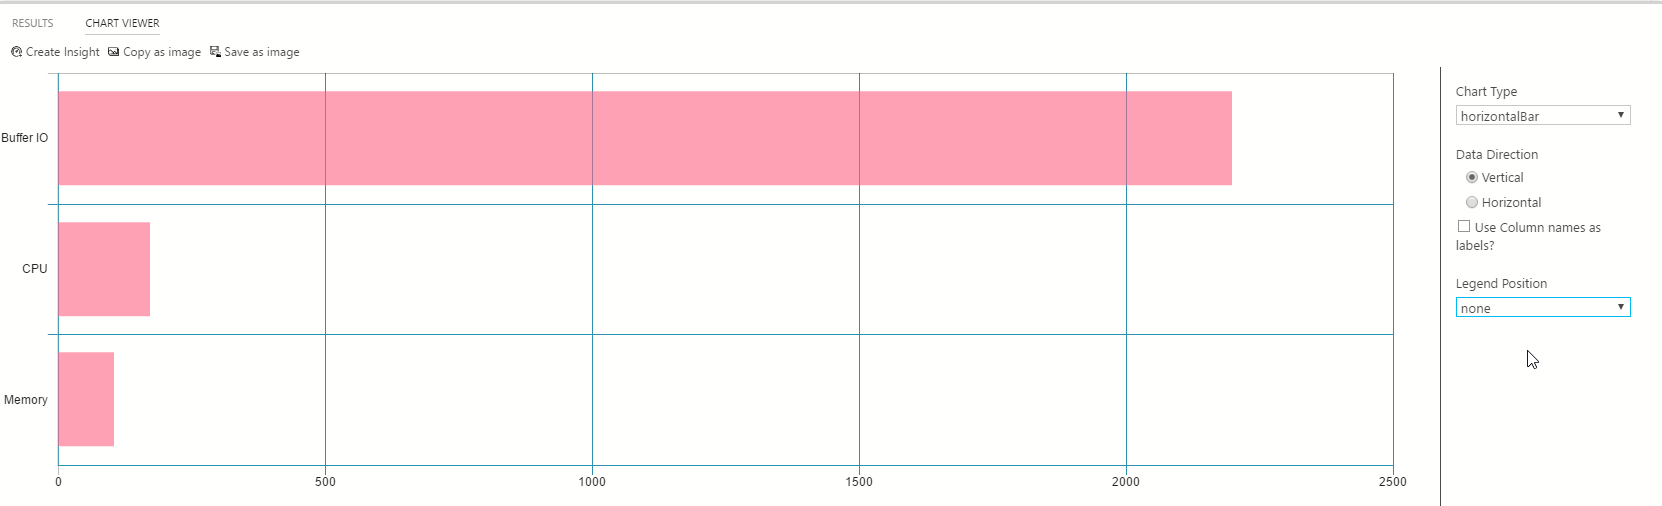
Once you have selected your options click on the Create Insights button to view the JSON for the widget. Go ahead and replace the My-Widget portion with the name you want the widget to have. Copy the JSON to your clipboard and hit CTRL + COMMA to bring your user settings. In the search bar at the top search for “dashboard” and find “dashboard.database.widgets” then click on edit to have it bring up a section on the right-hand side for you to insert the JSON you copied to your clipboard.
Just before the closing bracket ] put a common after } and go to the next line and insert your widget code to make it look like so:
        },
        {
            "name": "Waits for Last Day",
            "gridItemConfig": {
                "sizex": 2,
                "sizey": 1
            },
            "widget": {
                "insights-widget": {
                    "type": {
                        "horizontalBar": {
                            "dataDirection": "vertical",
                            "dataType": "number",
                            "legendPosition": "none",
                            "labelFirstColumn": false,
                            "columnsAsLabels": false
                        }
                    },
                    "queryFile": "qs_waits_stats_lastday.sql"
                }
            }
        }
    ]
}
Then save your settings file. Now you go and open any 2017 database that has query store enabled and have a view of your waits for the last day.