
Problem
We need a way to collect performance metrics for all our SQL Servers (Windows and Linux) into one system and display that information in a way our DBAs can read it. Also, we would like to keep the cost down.
I know this blog looks really long and may look like it’s hard to set up but it really isn’t take if from Kevin Feasel.
Solution
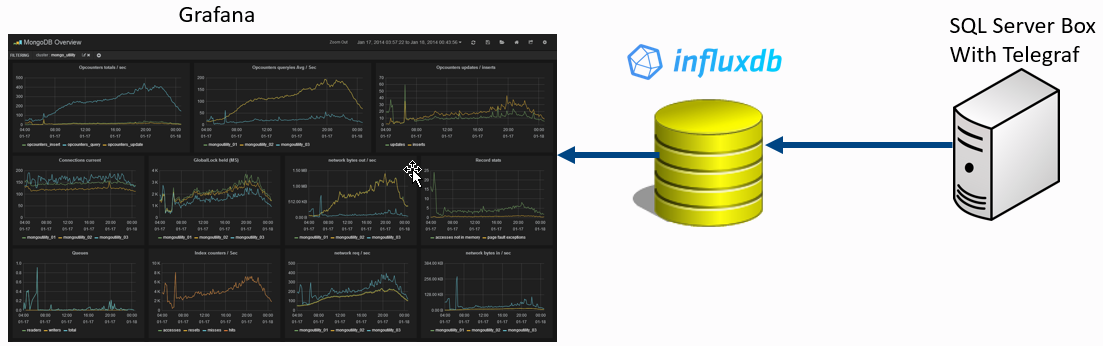
The complete solution for Telgraf involves having InfluxDB and Grafana installed to displayed to show the data collected from the Telegraf plugin (which I would like to thank my coworker Mark Wilkinson (b | t) for working on to improve). Both InfluxDb and Grafana will be installed on a Linux machine to minimize cost (let’s not pay for the operating system) I will be using CentOs for our flavor of Linux. So after you have your operating system up and running here are the steps to install each component. I suggest spinning up boxes in the Cloud with your flavor of Linux on it. My company is monitoring 500 servers on an InfluxDB Linux server paying about $3000 dollars a year for the instance. So you don’t need a beefy machine I suggest 8 CPU with 32 GBs of memory with 600 GBs of disk space a year’s worth of data. Here is a diagram of what our solution entails:

We have in the middle an open source time series database called InfluxDB is designed for collecting data that is timestamped such as performance metrics. Into that, we feed data from an open source project called Telegraf which can feed in more than just SQL Server statistics. And to be able to show us the data in nice pretty graphs that we can manipulate, drill-down on, and even set up alerts we display it using Grafana.
First Off
Let’s update the operating system, install wget so we download packages from the Internet, and firewalld so we can manage our ports that are allowed to communicate out on our Linux machines. As with everything we install we will get asked if it’s OK to install it so just hit y and Enter and let install on your system.
su -c 'yum update'
sudo yum install wget
sudo yum install firewalld
sudo systemctl start firewalld
sudo systemctl enable firewalld
Install and Configure InfluxDB
Once you have your Linux OS installed use can use the following commands to install InfluxDB (all versions of Linux can found at this link and you should go here to get the most current version):
wget https://dl.influxdata.com/influxdb/releases/influxdb-1.4.2.x86_64.rpm
sudo yum localinstall influxdb-1.4.2.x86_64.rpm
Next, you want to start the influx service and set it to autostart:
sudo service influxdb start
sudo systemctl enable influxdb
Next, you will want to set up the ports to open in the firewall on Linux:
firewall-cmd --zone=public --add-port=8086/tcp --permanent
firewall-cmd --zone=public --add-port=8083/tcp --permanent
firewall-cmd --reload
Finally, we need to create a database to store the database for the Telegraf information by entering into the program by typing:
influx
Then we create a database and set your retention policy for 365 days or adjust to your needs:
CREATE DATABASE telegraf
CREATE RETENTION POLICY telegraf_1yr ON telegraf DURATION 365d REPLICATION 1 DEFAULT
And then you can run this to show databases:
SHOW DATABASES
Then just type Exit to leave influx.
exit
That’s it InfluxDB is installed and ready to go. To test you got to any browser and connect to the server via http://servername:8083.
Install and Configure Grafana
The install process for Grafana is similar. Once you have your Linux OS installed use can use the following commands to install Grafana (all versions of Linux can found at this link and you should go here to get the most current version):
wget https://s3-us-west-2.amazonaws.com/grafana-releases/release/grafana-5.0.0-1.x86_64.rpm
sudo yum install initscripts fontconfig
sudo yum localinstall grafana-5.0.0-1.x86_64.rpm
Next, you want to start the Grafana service and set it to autostart:
sudo service grafana-server start
sudo systemctl enable grafana-server
Now let’s install some plugins:
sudo grafana-cli plugins install natel-discrete-panel
sudo grafana-cli plugins install savantly-heatmap-panel
sudo grafana-cli plugins install grafana-piechart-panel
Then you have to restart the Grafana service because we installed the plugins:
sudo service grafana-server restart
Next, you will want to set up the ports to open in the firewall on Linux:
firewall-cmd --zone=public --add-port=3000/tcp --permanent
firewall-cmd --reload
That’s it Grafana is setup and ready to be used. You can verify that by connecting to in a browser using http://servername:3000.
Install and Configure Telegraf for SQL Server on Windows
Our first step in setting up Telegraf will be setting the telegraf user on our SQL servers. The account needs VIEW SERVER STATE and VIEW ANY DEFINITION permissions.
USE master;
GO
CREATE LOGIN [telegraf] WITH PASSWORD = N'mystrongpassword';
GO
GRANT VIEW SERVER STATE TO [telegraf];
GO
GRANT VIEW ANY DEFINITION TO [telegraf];
GO
Next download the current zip file from the website:
Unzip the file to a network location so we can use PowerShell to install it remotely on multiple servers. But before we go and do the install we need to edit the config file.
Now is a good time to explore the telegraf.conf file which is very long. I suggest shortening it down to things you care about collecting on your machine or you can leave it all in there, it comes with almost everything commented out. There is a section before the OUTPUT PLUGINS that you should leave in the file and recommend leaving the setting as is. First, we need to configure where our output from telegraf will go, and that is to our influxdb. Each line with that starts with # is commented out. So first you make sure these lines are uncommented and configured correctly [[output.influxdb]] line, urls, and change to your server name or IP address, and set the database. This section usually has the necessary lines uncommented by default but just case those are the only things I have configured.
###############################################################################
#                            OUTPUT PLUGINS                                   #
###############################################################################
[[outputs.influxdb]]
  ## The full HTTP or UDP URL for your InfluxDB instance.
  ##
  ## Multiple urls can be specified as part of the same cluster,
  ## this means that only ONE of the urls will be written to each interval.
  # urls = ["udp://127.0.0.1:8089"] # UDP endpoint example
  urls = ["http://192.168.31.10:8086"] # required
  ## The target database for metrics (telegraf will create it if not exists).
  database = "telegraf" # required

  ## Name of existing retention policy to write to.  Empty string writes to
  ## the default retention policy.
  retention_policy = ""
  ## Write consistency (clusters only), can be: "any", "one", "quorum", "all"
  write_consistency = "any"

  ## Write timeout (for the InfluxDB client), formatted as a string.
  ## If not provided, will default to 5s. 0s means no timeout (not recommended).
  timeout = "5s"
  # username = "telegraf"
  # password = "metricsmetricsmetricsmetrics"
  ## Set the user agent for HTTP POSTs (can be useful for log differentiation)
  # user_agent = "telegraf"
  ## Set UDP payload size, defaults to InfluxDB UDP Client default (512 bytes)
  # udp_payload = 512

  ## Optional SSL Config
  # ssl_ca = "/etc/telegraf/ca.pem"
  # ssl_cert = "/etc/telegraf/cert.pem"
  # ssl_key = "/etc/telegraf/key.pem"
  ## Use SSL but skip chain & host verification
  # insecure_skip_verify = false

  ## HTTP Proxy Config
  # http_proxy = "http://corporate.proxy:3128"

  ## Optional HTTP headers
  # http_headers = {"X-Special-Header" = "Special-Value"}
Next, we need to set up out what data will be inputted into InfluxDB from SQL Server. Here all you need to change is the password you create for your user. There is more to go into around options that I will save for another post.
###############################################################################
#                            INPUT PLUGINS                                    #
###############################################################################
[[inputs.sqlserver]]
  servers = [
    "Server=localhost;Port=1433;User Id=telegraf;Password=<mystrongpassword>;app name=telegraf;log=1;",
  ]
  #
  ## Optional parameter, setting this to two will use a new version
  ## of the collection queries that break compatibility with the original
  ## dashboards.
  query_version = 2
  ## If you are using AzureDB, setting this to True will gather resource utilization metrics
  # azuredb = False
  ## If you would like to exclude some of the metrics queries, list them here
  # exclude_query = [ 'PerformanceCounters','WaitStatsCatagorized' ]

[[inputs.win_perf_counters.object]]
  # Processor usage, alternative to native, reports on a per core.
  ObjectName = "Processor"
  Instances = ["*"]
  Counters = ["% Idle Time", "% Interrupt Time", "% Privileged Time", "% User Time", "% Processor Time"]
  Measurement = "sql_cpu"
  #IncludeTotal=false #Set to true to include _Total instance when querying for all (*).

[[inputs.win_perf_counters.object]]
  ObjectName = "LogicalDisk"
  Instances = ["*"]
  Counters = ["% Free Space","Free Megabytes","Avg. Disk Read Queue Length","Avg. Disk Write Queue Length","Avg. Disk sec/Read","Avg. Disk sec/Write"]
  Measurement = "sql_disk"
Lastly, we can install and start the service to our Windows machines using PowerShell.
 $servers = @(
    'server1', 'server2'
)
$servers | % {
    Write-Host "$($_)..."
    New-Item -Path "\\$($_)\c$\Program Files\telegraf" -ItemType Directory -Force
    Copy-Item -Path "\\server\telegraf\telegraf.*" -Destination "\\$($_)\c$\Program Files\telegraf\" -Force
    Invoke-Command -ComputerName $_ -ScriptBlock {
        Stop-Service -Name telegraf -ErrorAction SilentlyContinue
        & "c:\program files\telegraf\telegraf.exe" --service install -config "c:\program files\telegraf\telegraf.conf"
        Start-Service -Name telegraf
    }
}
Now that you have data pumping into InfluxDB it’s time to pay a visit back to Grafana and set up our dashboards so we can see our data.
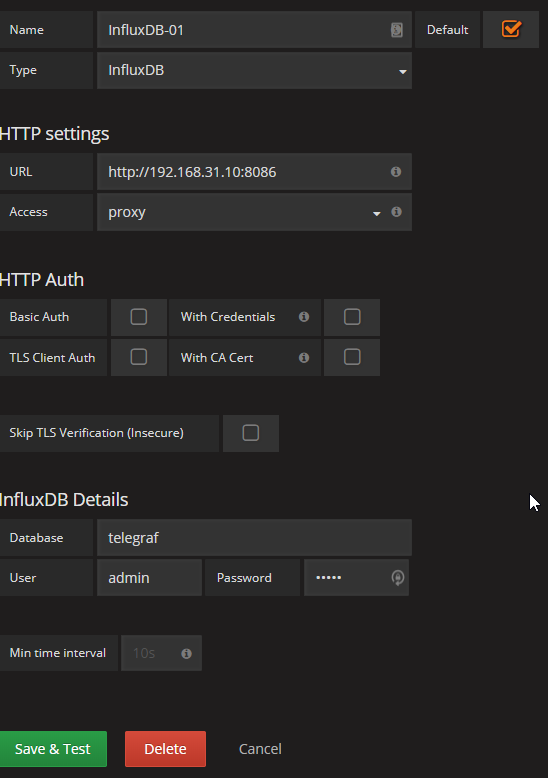
Setup a Data Source in Grafana
Once in Grafana, you navigate via the orange icon in the right-hand corner so let’s click on that click on Data Sources then click on the green button to Add data source. Then we can fill out the screen to make look similar to the one below. You will want to give it a Name which doesn’t mean anything but will make importing the dashboards I give you easier if you name it the same as the one below. Select the Type InFluxDB and the bottom part of the screen should change. Tick off the Default box, because later on in this series we will be setting up other systems to monitor and need a different data source. Next, fill out the HTTP settings with your URL and then jump down to InfluxDB Details and specify the Database and User be default is admin with password admin. Then you can click Save and it will test rather it can connect or not.
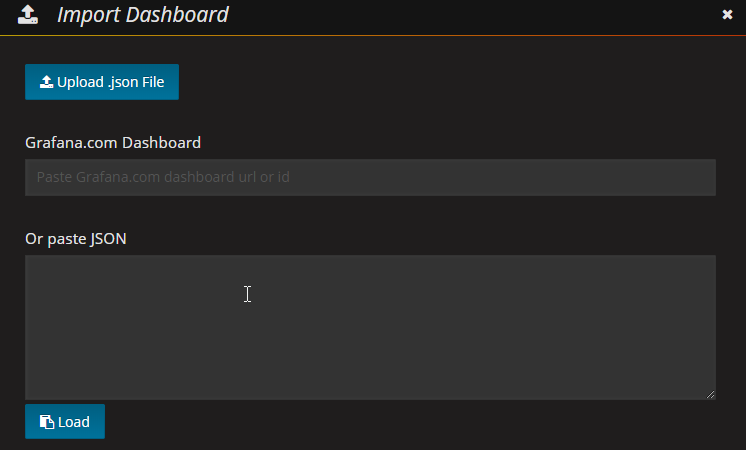
Setting up a Dashboard
Next, let’s set up one dashboard so you can see some data. After all you came all this way to get something out of this post right. Again we can click on the orange icon in the right-hand corner, click on Dashboards then click on Import. Now we can paste JSON code that will contain everything you need for your dashboard. Then you can click Load and the name of the Dashboard will auto-populate and you can if you like. To get the dashboards from GitHub. I suggest for the most wow factor opening up the SQL Instance Overview file and pasting that JSON into the Window.
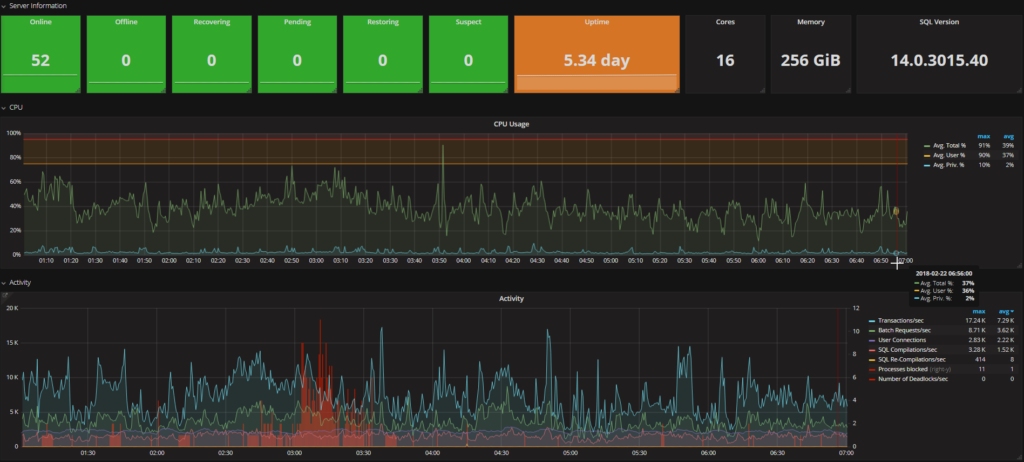
Looking at the SQL Instance Overview Dashboard
The SQL Instance Overview Dashboard has several panels on it that works both on a Windows and Linux machine but we will cover how to install telegraf on Linux in another post:
- Server Information
- CPU Usage (displays both Windows and Linux metrics)
- Activity
- Lock Timeouts
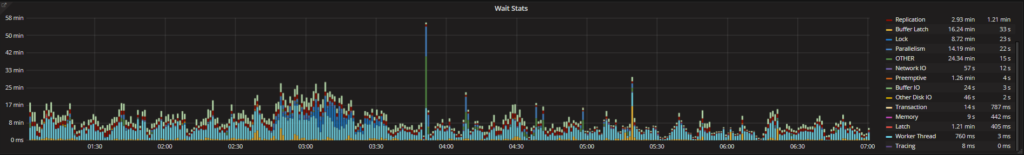
- Wait Types (grouped together like they are in Query Store 2017)
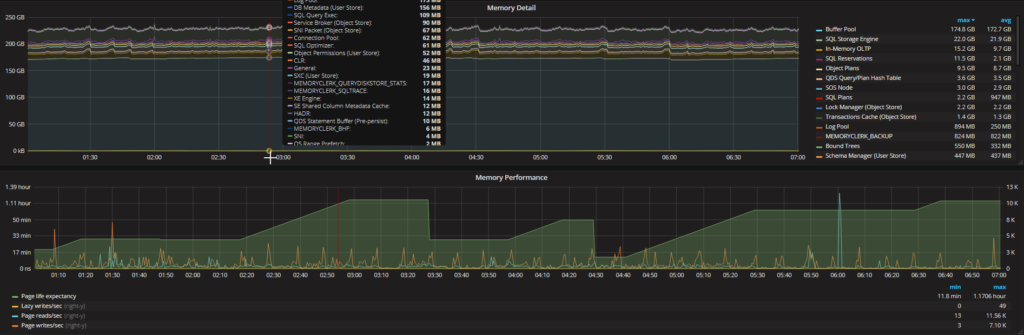
- Memory Detail
- Memory Performance
- TempDB Usage
- Temp Tables
- Read Latency (Windows and Linux)
- Write Latency (Windows and Linux)
- Free Space
- Database Size
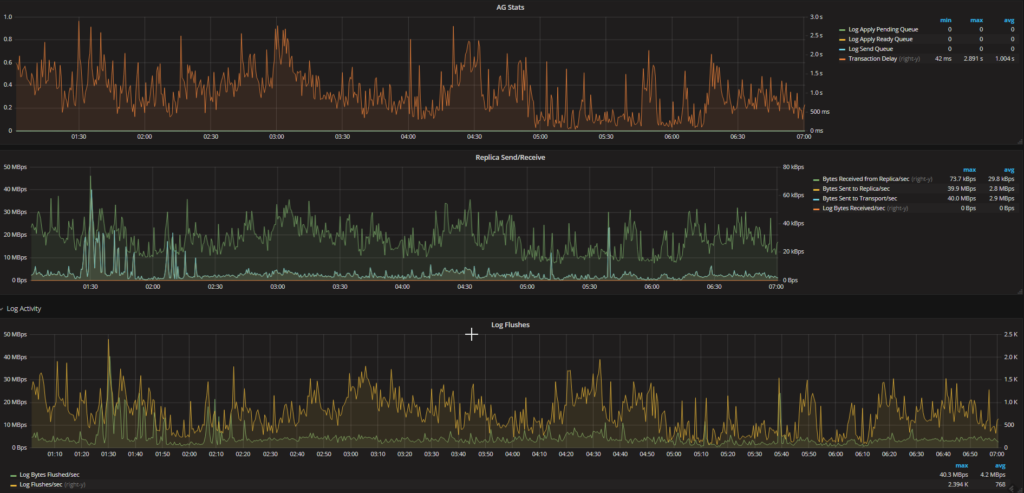
- AG Stats
- Replica Send/Receive
- Log Flushes
- Log Flush Wait Times
- Resource Governor Specific Panels:
- CPU % By Group
- Requests/Sec by Group
- Blocked Tasks by Group
Some selected print screens form a live production system are below:
Frank Henninger has come up with some cool dashboards and ways to customize more dashboards and get more data. Check out his blog series here.
Install Telegraf on SQL on Linux
Now that you have seen how powerful it is you should go ahead learn how to set it up to monitor your SQL on Linux machines after all that was the whole point of this project to monitor things across platforms. So we first need to download install the package. Make sure you create your user on your SQL on Linux machine just like we did for Windows machine above.
wget https://dl.influxdata.com/telegraf/nightlies/telegraf-nightly.x86_64.rpm
sudo yum localinstall telegraf-nightly.x86_64.rpm
We need to generate a special config file for the Linux machine to capture the CPU and disk metrics. This config file will be in your /etc/telegraf folder.
cd /bin/telegraf
./telegraf --config /etc/telgraf/telegraf.conf --input-filter cpu:mem:sqlserver --output-filter influxdb
After you run this you will need to open it with your favorite editor, mine is vim:
sudo vi /etc/telegraf/telegraf.conf
Once the file the is open you can type the letter i to be able to edit the file. Then type /influxdb to find the outputs.influxdb section of the file and edit the same sections we edited for Windows. Type /inputs.sqlserver to jump down and edit the SQL Server section. It should match the same thing we put in for our Windows box. After you have finished editing the file in vim you can type Esc then :wq! and the hit Enter for it save the config file.
Next, you want to start the telegraf service and set it to autostart but before that, we need to open the port to InfluxDB:
firewall-cmd --zone=public --add-port=8086/tcp --permanent
firewall-cmd --reload

sudo service telegraf start
sudo systemctl enable telegraf
Now you should be getting data from your Linux box into your Grafana Dashboard.
Up Next
We talk more about what is actually captured in the dashboard you loaded and how to use the dashboard and information in it.


Love the post, but I think I am missing something. None of your telegraf.conf have the metrics needed for sql. I used telegraf_sqlserver.conf and the reporting is working for CPU and disk, because that is all that is included. Could you include all of the per_counters that correlate with your Instance overview dashboard? Thank you.
No, you are not missing anything the query_version tells it what versions of DMV queries to run to collect the SQL specific metrics. You can go here to read a little bit more on it and see the exact code in GO https://github.com/influxdata/telegraf/tree/master/plugins/inputs/sqlserver.
I apologize as my DBA sent me this blog, but the SQL metrics aren’t working. Is there any other action that the DBA has to take other than setting the view only account as mentioned in your article? We have the telegraf.conf set to use version 2. The DBA was under the impression that it was kind of “plug and play”. What else would prevent Telegraf from collecting the SQL metrics? Thank you for your time.
I figured it out. Didn’t follow the directions. I thought I would be creative and used a different user account name for SQL permissions. This did not work. I changed it to the stated “telegraf” user and all is well. Again, thank you for your time.
If you want a different user you have to change the connection string the .conf file. But glad it worked. Let me know how things go and if there are metrics that you want to see that you are not seeing.
Its a nice post very helpful.
For telegraf, Is there a way to use windows (trusted) authentication instead of SQL.
I have a question regarding
[[inputs.sqlserver]]
servers =